I have done this before but again when I search I could not find any good link on how to monitor FRA using OEM.
There are two sub metrics under 'Recovery Area', 'Recovery Area Free Space (%)' and 'Recovery Area Used Space (%)'.
Recovery Area Free Space (%) by definition is only for metric collection purpose. No thresholds can be set for this metric and hence no alerts will be generated for this metric.
Recovery Area Used Space (%) is used for collection and alerting. Enterprise Manager allows customers to set thresholds for this metric starting from 18c databases and alerts will be generated accordingly.
For customer using older version of database like 11g or 12c there is no metric in OEM to monitor FRA.
So the best and simple option I found is to create a metric extension and use it.
How to create metric extension for FRA usage:
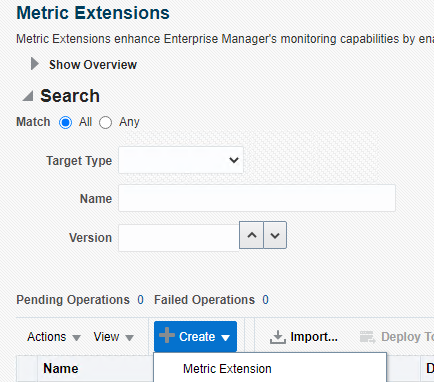
1. Login to OEM console --> Enterprise --> Monitoring --> Metric Extensions

2. Click on create --> Metric Extension
Target type = Database Instance
Name ME$ = provide any name like FRA
Display name = FRA
Adapter = SQL
Description = FRA free percentage
You don't need to change Collection schedule for now.

4. Click next and use below SQL to monitor FRA. (I used below SQL but you can use any other SQL if you are already using)
SELECT (CASE WHEN PERCENT_USED> 100 THEN 0 ELSE (100-PERCENT_USED) END) PERCENT_FREE
  FROM (SELECT (SUM(PERCENT_SPACE_USED)-SUM(PERCENT_SPACE_RECLAIMABLE)) PERCENT_USED
  FROM V$FLASH_RECOVERY_AREA_USAGE);
This query will provide FRA free percentage value. You should run this query on any database before using in metric extension like below.

Once you ready with query use it in Metric Extension

5. Click next and here we will specify the Metric columns , as you see in above SQL output screenshot , I have only one column returned, PERCENT_FREE so I will use that to setup threshold.
click Add --> New metric column

6. Provide values like name, display name , unit, value type. Alert threshold is optional you van provide now or later, I provide here.

7. Click next, here you have to provide DB credentials, You can use Default Monitoring credentials

8. Click Next, here you can test if the metric is working or not before finish it.
Add target and click on run test and you will see the result in Test result.

9. Click Finish and Metric Extension is ready to Deploy.
10. Now click on Actions and click on "Save As Deployable Draft"
11. Again Click on Actions and click Deploy to Targets, here you have to add all Database instance targets where you want to add this extension.
12. Click Submit and now you can see Deployed targets.
13. Last thing is we need to publish this Metric Extension.
Click on Actions again --> "Publish Metric Extension" and it will publish.
14. Now you can go to any deployable target DB home page and go to Oracle database --> Monitoring--> Metric and collection settings

15. You can see this metric added now and you can modify threshold here if needed.
Same way we can setup Metric Extension for anything which we want to monitor and if Oracle does not provide any default metric in OEM.


No comments:
Post a Comment